—— Recently, a series of new reports on the New York real estate market Q2 2016 were released by Douglas Elliman, a well-known real estate brokerage company in the United States, and Miller Samuel Real Estate Appraisers, a market research partner. This article will give you an overview of the Brooks mentioned in these reports. Forest, Manhattan, and market movements in Queens.
Manhattan Market
Manhattan Condo & Co-op Market Data
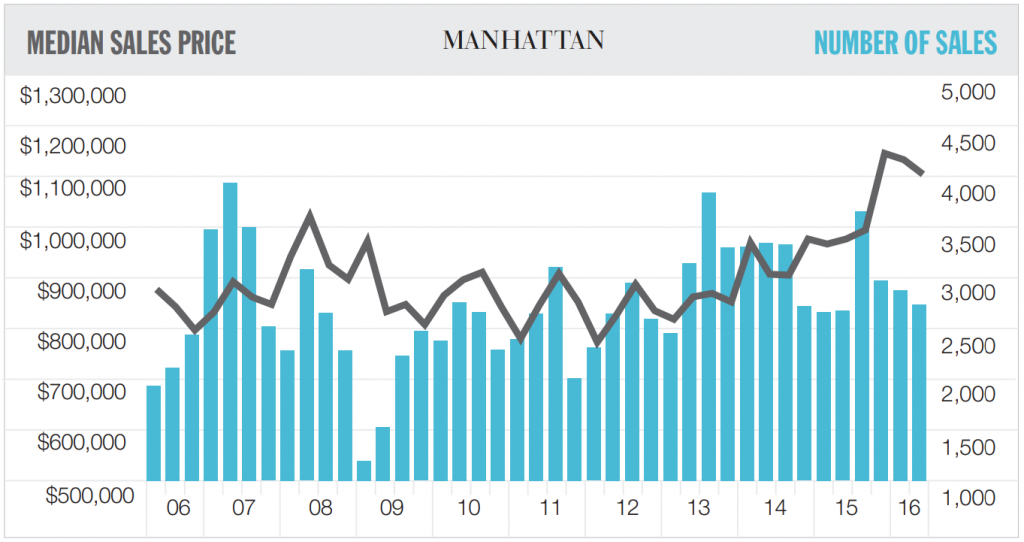
In the second quarter of 2016, the median price of condos and co-ops in Manhattan was $1.1 million, an increase of 13.1% YoY and a decrease of 2.5% from the first quarter of 2016. The average sales price was $2.03 million, an increase of 8.4% YoY and a decrease of 1.1% from the previous quarter. Price per square foot reached $1,759, a record 2.7% increase from the first quarter.
The market activities of resale are very active, accounting for 81.5% of the total market transaction activity. At the same time, due to three consecutive years of active resale, the inventory of Manhattan resale homes has been undersupplied, replaced by a large number of new homes on the market.
Manhattan Condo Market Data
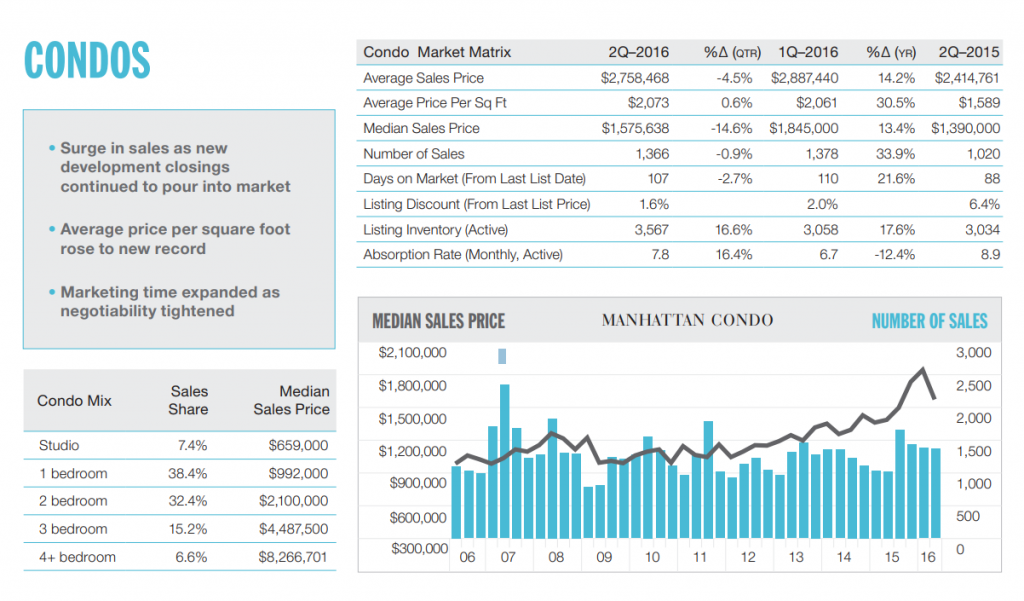
For condos, the total number of transactions in the second quarter was 1,366, and the average time on the market per condo was 107 days. The inventory of condos listed for sale rose to 3,567 units, up 16.6% from the first quarter, as the supply of new homes rose. The average price remained at $2,758,468 per set, down 4.5% from the first quarter.
Generally speaking, Manhattan’s residential market has maintained a good and positive market environment. The more prominent ones are the changes in the market inventory of re-sold old houses and a large number of new houses. It is believed that in the next few years, new units will be more important.
Queens Market
After a small price adjustment late last year and early this year, the overall residential market in Queens (including condos and co-ops) gradually recovered in the second quarter of 2016, with the average condo price rising to $526,943, with the median selling price The number reached $465,000. Compared to the same period last year, housing prices across Queens have increased significantly, with average and median price increases of 10.8% and 16.3%, respectively.
From 2014 to the second quarter of 2016, the median house price in Queens fluctuated widely, but the overall trend was on the rise.
At the same time, condos were listed on the market for a short 80 days in the second quarter of this year, which is more robust than in Manhattan. Inventory listed for sale also increased, rising to 4,403 units.
Queens Condo & Co-op Market Data
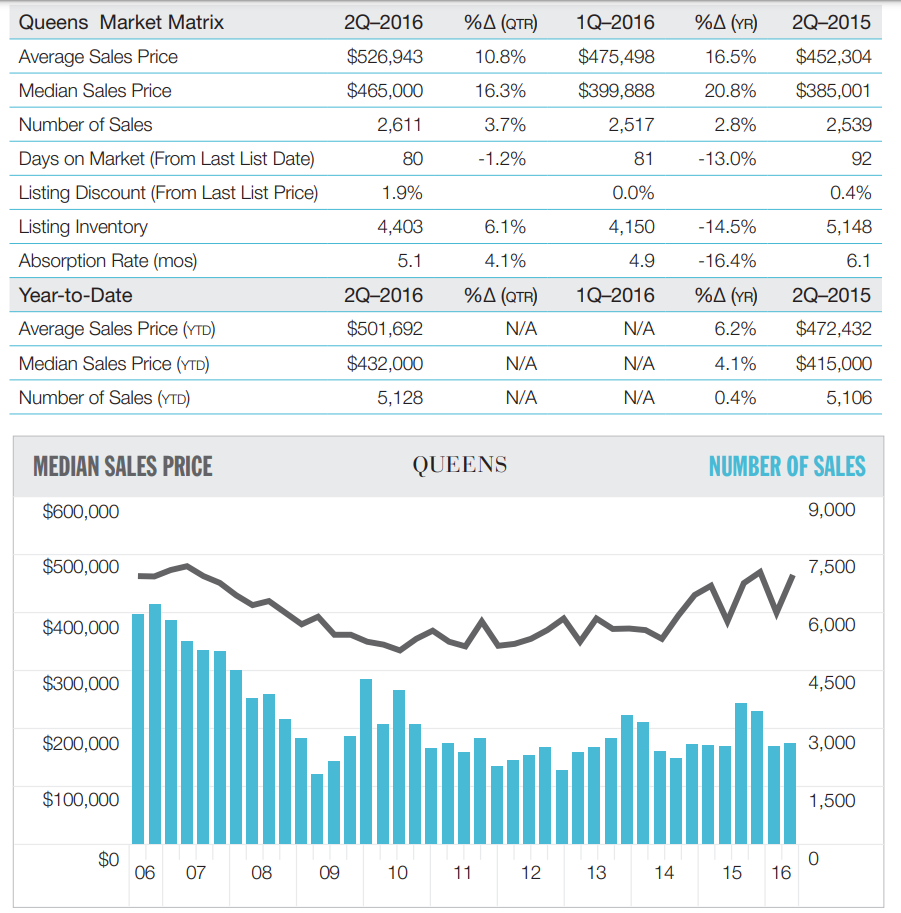
It is worth mentioning that in recent years, the prices of condos and co-ops in Queens have been on a steady upward trend. However, the prices of 1-3 family houses in this area have fluctuated greatly, and the transaction activity in the market has also been relatively high. Active, local home buyers have a stable demand for self-occupation.
Brooklyn Market
In the second quarter of 2016, the sales price and the number of sales of Brooklyn condos and co-ops were relatively stable, with a median sales of $659,000, an increase of 8.9% YoY, and a decrease of 0.5% from the previous quarter; the average sales price was $816,827, an increase of 3.6% YoY, and an increase of 2.7% over the previous quarter. A total of 1,888 homes were sold in the second quarter, up 8.8% from a year earlier.
Brooklyn Condo & Co-op Market Data
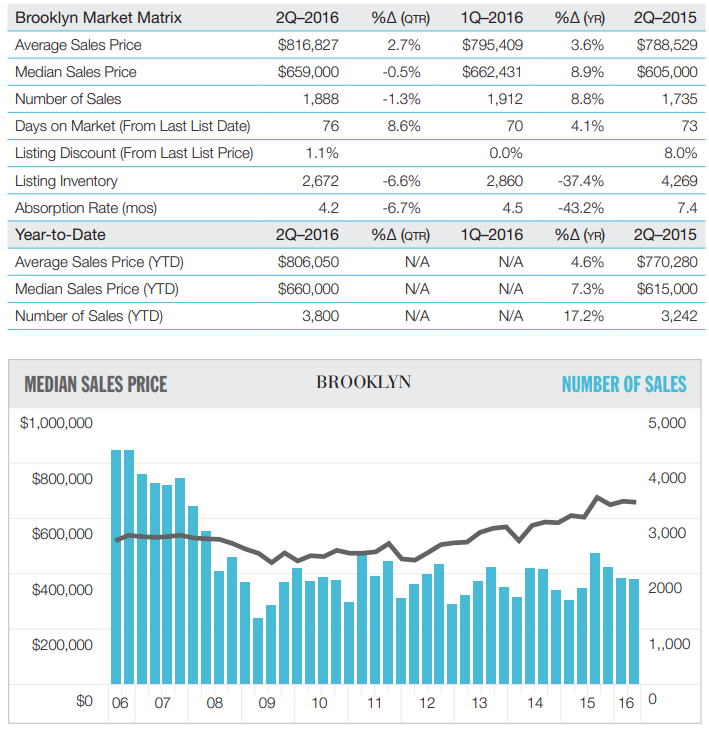
Compared with Manhattan and Queens, residential unit prices in Brooklyn have been more stable and have become more and more popular in the market in recent years. On the other hand, compared to the plentiful market inventory in Manhattan and Queens, the inventory of residential units for sale in the Brooklyn area was only 2,672 in the second quarter, down 37.4% YoY, while overall sales reached 3,800 units in the second quarter, an increase of 17.2% YoY.
Brooklyn New Development Data
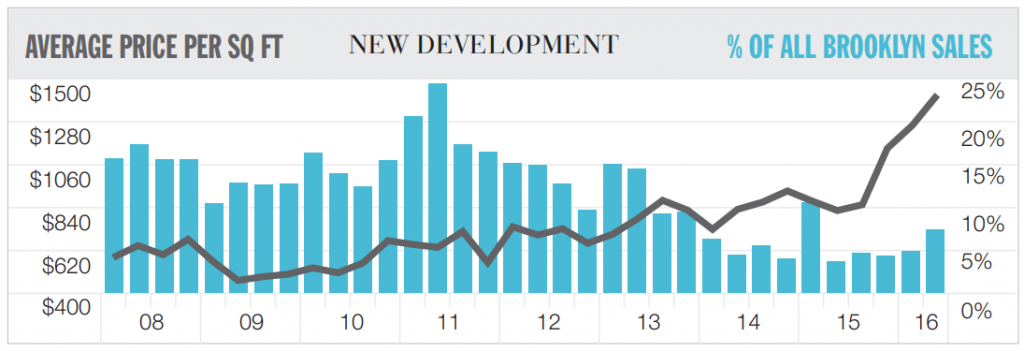
In terms of new development, the price per square foot of Brooklyn condos has been on an upward trend since 2009, and it has grown at an astonishing rate from the second quarter of 2015 to the second quarter of 2016. The price per square foot in the second quarter of 2016 increased by as much as 71.4% compared with the same period last year and increased by 12.4% compared with the previous quarter, and the number of sales increased by 115.4% compared with the same period last year.
This article refers to The Elliman Reports, provided by DouglasElliman and Miller Samuel Inc.